


Key takeaways
- Execution time is a coverage concern. A detector that doesn't finish produces silence, and silence is indistinguishable from a clean environment.
- The skills gap is the root cause. Detection engineers are trained to find attacks, not to tune distributed queries. The fix is to encode the data engineering knowledge where it gets applied automatically.
- The bar is "faster and provably identical." What a rule catches, how findings are grouped, and what reaches the analyst are all off limits.
- Standard tuning advice can be wrong at platform scale. Some of the most widely recommended Spark optimizations help a single job and hurt a system running hundreds of them concurrently.
- Two months of manual work became a rulebook of 34 changes. The rulebook became a pipeline that has now upgraded more than 300 detectors. Detectors that improved cut runtime by 15% to 60% each.
Once you move to a cloud security data lake and start ingesting cloud telemetry at volume, detection engineering enters the realm of data engineering. You shift the focus from asking only “does this rule catch the attack?” to also asking “does this rule complete execution within its budget?”
Most detection engineers get to that question unprepared. This discipline recruits from threat hunting, adversary research, and detection design. They learn to read an attack, work out what distinguishes it from normal activity, and express it as logic. Distributed query optimization isn’t part of that training, and it doesn’t need to be for most of a career.
Then this logic comes face-to-face with the environment. A customer has millions of rows for your rule to evaluate. And you multiply that by all the customers and all the rules running concurrently, and a detection can be correct and still be unaffordable. What seems like good logic when brainstorming on a whiteboard can be more than the platform can run in the time it has, and how data behaves during ETL (extract, transform, and load) is something the logic's author didn't have visibility into when they wrote it.
That gap is a structural property of doing detection at scale, not a defect of any one platform. It comes on a schedule, because every organization that’s ingesting more data this quarter than last is pushing its detectors closer to their limits, regardless of whether anyone is watching.
The problem: detectors that never finish
A failure mode that produces no error
Most detection failures proclaim their own arrival. A rule that throws an exception shows up in a log. A rule that fires too often shows up in an analyst's queue.
A rule that exceeds its execution budget? That appears nowhere. It’s terminated before it completes, returns no results, and raises nothing that a typical alerting path would surface. No output is a valid output and is the same shape as “no attack today.” Events that rule was built to catch pass through unexamined.
The second dimension is financial, and it’s the one most organizations first measure. Every second a detector is over budget is cluster time someone is paying for, times environments, times days. Runtime becomes visible to the business because it shows up on an invoice. These two dimensions point the same way. The work that reduces compute cost is the work that protects detection coverage.
Why you can't solve this one detector at a time
Your first impulse is to go at them one by one. Just open up the slow ones, get a sense of what each one is doing, and fix it. Then move on to the next.
With a catalog in the thousands, that becomes a queue that grows faster than it drains. New detections ship continuously, and existing ones drift toward their limits as volumes rise. Any solution to this has to work at scale, which means asking "what makes detectors slow generally, and can that be expressed as rules?"
So the investigation moved from individual detectors to patterns across the catalog.
The PySpark operations we reach for by default. Detection logic is built from a fairly small vocabulary of transformations, and they are not equally priced. Mapping which operations appear most often across our detections, and asking for each one whether a cheaper equivalent exists, turned out to be the highest-leverage question available. It's also the question a detection engineer has no particular reason to know the answer to.
The order those operations run in. The same operations in a different sequence cost very different amounts. Anything that reduces the working set should happen before anything expensive touches it. At this scale, filtering early and parsing late decides how much data the expensive work has to process at all, and therefore how quickly the alert reaches the customer.
Where the cost concentrates
The detectors that consumed the most resources were disproportionately reading from CloudTrail.
CloudTrail is the audit record of activity in an AWS account: identity and access operations, console sign-ins, permission and policy changes, secret and key access, infrastructure changes, and optionally much higher-volume object-level activity. That breadth is what makes it indispensable for detection. It's also what makes it awkward to query because a single log format has to describe hundreds of different operations, and the detail of each has to live somewhere.
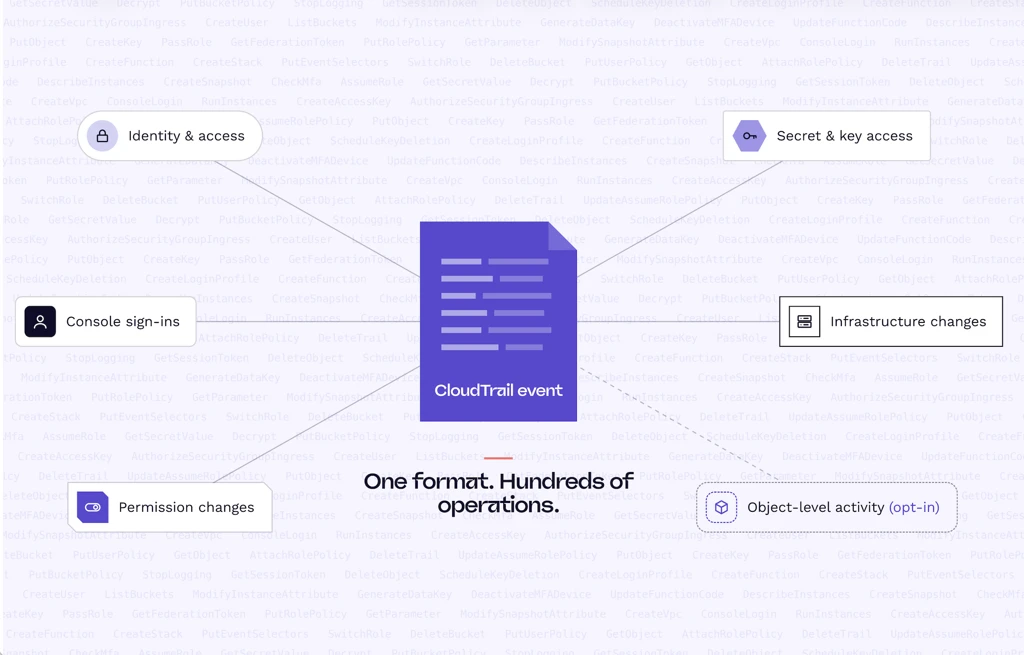
That detail lives in two catch-all containers, requestParameters and responseElements. They hold whatever a given operation happens to involve, and they carry most of the detail AWS-focused detection logic needs.
Size is part of the cost. These fields hold substantial JSON payloads, and parsing cost scales with the length of the string being parsed. The bottleneck is that they're also dynamic. Their internal structure changes completely depending on the event type: a CreateBucket and an AssumeRole share the field name and nothing inside it. Size makes each parse expensive, and dynamism is why you pay for it repeatedly and why you can't fix it upstream.
The instinct is to flatten them once into a shared schema, so no detector pays again. That instinct is right for a stable nested structure. Here it breaks on arithmetic. Across our catalog, 90 distinct fields from requestParameters and 48 from responseElements are in active use, so a shared schema would carry all 138. And 138 is a floor, because the same field name can hold different types across operations. That would force the column to be qualified per event type. Flattening at ingest would also parse every field on every event, including the overwhelming majority no detector ever queries, when detection logic only runs against a filtered slice.
So the parse moves into the detector, with each one declaring the fields it needs and structuring them before the detection logic runs. The detector knows which fields it uses. Nothing upstream does.
The process: from manual tuning to 34 rules
Two months by hand
Before any of this could be automated, it had to be understood, and that meant doing it manually for a while. That took roughly two months of opening detectors, working out what was expensive, changing it, and confirming nothing about the detection had changed.
The optimized detectors were the visible output of those two months, but the durable one was a precise understanding of which changes are safe to make, and the exact conditions under which each stops being safe.
The research question was narrower than "how do we make Spark faster?" We asked which changes improve runtime while provably leaving the detection untouched. Untouched means the same alerts, carrying the same data, for any possible input.
We measured everything against a single test:
Does this change produce exactly the same rows, with exactly the same column values, for any possible input?
Anything that couldn't be answered yes was either rejected or marked as requiring a human. That filter eliminated a lot of otherwise attractive optimizations, and the rejections turned out to be as valuable as the approvals.
What survived were 34 rules, with each rule’s safety guaranty and, more important, its preconditions, the specific circumstances under which a change that is safe normally is no longer safe.
A few examples:
- Collapsing multiple JSON lookups on the same column into one structural parse. Safe only when the single parse's schema covers every field the detector's logic extracts from that column, and only when there are more than two such lookups in the file. At one or two, the overhead of building the schema offsets the gain. Applied below that threshold, the optimization increases runtime instead of reducing it.
- Removing a
distinct()that follows an aggregation. Grouping keys are unique by definition, so the deduplication is redundant, unless a join or union sits between them, in which case it's doing real work. - Dropping a
lower()call when the regex already handles case-insensitivity. Safe when the pattern carries the case-insensitive flag. If the pattern is merely all-lowercase, thatlower()is the mechanism, and removing it silently breaks matching. - Moving a filter earlier in the chain. Safe when the condition text is character-for-character identical and references no column introduced later, and it only pays off when the filter meaningfully narrows the data the expensive step downstream has to touch.
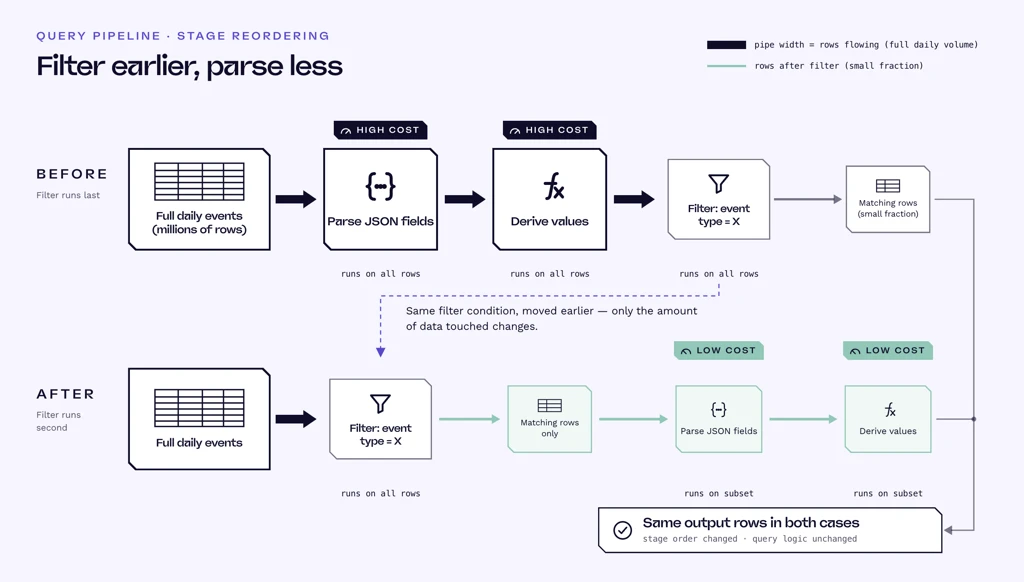
You cannot automate a judgment you haven't written down, and "use from_json instead of repeated extraction" is not a judgment. "Use it above two calls, when the schema is complete, and never with an inferred schema" is.
Why we rejected the standard advice
Not every optimization that helps a single Spark job helps a platform running hundreds of them.
cache(), persist(), and broadcast() are the canonical recommendations for speeding up Spark work. We used to use them. We stopped.
Part of the reason is specific to our architecture: our ETL layer already caches upstream, so a detector adding its own caching duplicates work that has already happened and charges memory for the privilege. That won't be true everywhere. An optimization can only be evaluated against what the platform around it already does, and most tuning advice is written without knowing that.
Standard optimization advice assumes a single job running alone. We run a large suite of detectors concurrently against shared compute, so we ask a different question:
Does this make one detector faster without taking resources from the detectors running beside it?
Memory is a shared budget. An optimization that improves one rule but degrades throughput for the suite has only shifted the cost from one detector to the others running beside it.
The solution: an agentic optimization pipeline
After two months, the process was clear enough to describe precisely, and anything you can describe precisely you can delegate.
We delegated it to an agentic pipeline rather than a script, because applying these rules isn't a find-and-replace. It means reading a detector, seeing where its filters sit and which fields it touches, and judging whether a given rule is safe in that particular file. We did not delegate the decision about whether the result is correct. That's what the gates are for, and they are deliberately not the same agent that made the change.
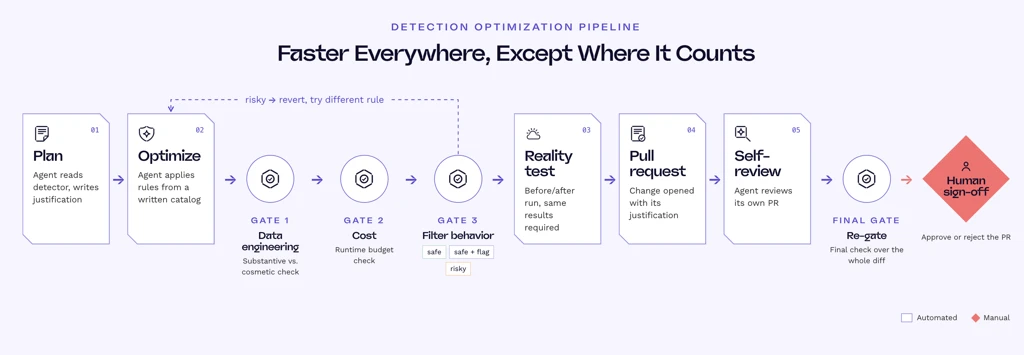
The pipeline runs the whole loop, from identifying detectors running close to their execution budget to a pull request ready for human review.
It plans before it touches anything
The agent starts by reading. It scans the detector's code in full and writes an explicit plan for that specific detector, stating which rules apply, where, and why each one is safe in this context.
That sequencing is deliberate. A plan is reviewable before any damage is done, and an agent that has to justify a change in advance applies fewer changes it can't defend. Only then does it execute.
It standardizes while it's in there
Many of the detectors most in need of optimization were also some of the longest-standing in the catalog. Those detectors had been catching real activity reliably for a long time, but they were written before current conventions existed.
Since the agent is already reading and rewriting each file, it also brings the detector up to current standards: aligning it with how we write detections now, enriching the information attached to the alert, enhancing alert descriptions, and improving MITRE ATT&CK mapping accuracy. Every finding is fixed during the run.
This surprised us most. Nobody would fund a project called "re-read all our old detectors." Performance work required opening every one of them anyway, which made it the forcing function for a quality pass that would otherwise never have been scheduled.
It gates, repeatedly, from different angles
Generating an optimization is easy, but proving it harmless is the entire challenge, so most of the pipeline is checks.
A data engineering gate reviews the changes from a data engineering perspective and asks a question the optimizer can't ask about itself: is this a substantive improvement, or a cosmetic change that won't measurably shorten the time an alert takes to reach a customer? Not every valid change is worth shipping.
A cost gate checks the changes against runtime cost thresholds, so an improvement has to meet a defined budget to pass.
A filter behavior gate protects the detection itself. It verifies that the attack behavior the detector is looking for hasn't changed and returns one of three verdicts: safe, safe with flag, or risky. If a change altered what the detector would catch, the agent reverts that detector to its original logic and tries a different optimization. If no behavior-preserving alternative exists, it raises a flag and records the finding in the final report rather than shipping something it can't justify.
The agent's goal is a change that passes, and failing to find one is an acceptable outcome.
Then the reality test. The detector runs twice, before and after, and the agent confirms that runtime improved and that the results are identical. If there's a runtime regression, it raises a flag and asks for review. The decision belongs to the person running the pipeline.
It reviews its own pull request
Once the gates pass, the agent opens a pull request and then performs an independent code review of its own changes, fixing everything that review surfaces.
After those fixes, all the gates run again, over the final state of the code. This confirms that everything applied since the first pass still improves the logic, and that nothing regressed across the sequence of gates and corrections. Changes made to satisfy one check can undo another, and the only way to know is to check the end state rather than the increments.
Only then is the pull request ready for human review.
What it may not touch
The pipeline is forbidden from changing the detector's identity and scope, the technique mapping and severity logic, the events and data sources it reads, the output schema including every column name and type, the grouping logic that determines what counts as one finding, and above all any filter condition. A filter may be repositioned only if its text is character-for-character identical.
Those properties decide what a rule catches and how it reaches an analyst. Runtime is not one of them. The pipeline may make a detector cheaper to execute. It may not make it a different detector.
Existing alert output is never altered. Columns keep their names and types, grouping is protected, and row survival is verified against the original. Fields can be added deliberately, as part of the standardization pass, but nothing already reaching an analyst is renamed, retyped, or removed, and nothing changes in production until a human merges. The original detector runs throughout.
Results
The pipeline has improved runtimes and upgraded more than 300 detectors.
The measurement we trust is the paired one, which runs the same detector for the same customer on the same date and cluster, once from main and once from the optimization branch, so the only variable is the code. Measured that way, detectors that improved came down between 15% and 60% in runtime.
Not every detector moves that much, and some show no measurable change today. That still counts. The fix is now in place regardless, so as data volume grows for that detector, it won't need to be found and rebuilt.
What we got wrong
Our termination-rate numbers were wrong at first. Latency percentiles looked reassuring on detectors we knew were struggling, because terminated runs never reach the metrics store. We were computing percentiles over the survivors, so the worst executions were systematically excluded from the sample meant to find them. A detector with a high termination rate can show an excellent p99 precisely because its bad runs are missing. Check whether your own detector dashboards have this bug.
A few optimizations made things slower. A small number of detectors the agent enhanced came out worse than they went in, and the reason had nothing to do with the query plan. It was the data itself.
The rule we were applying replaces several separate JSON lookups with one parse of the whole structure. That is normally cheaper. But a handful of event types carry unusually large, deeply nested payloads, and parsing one of those means building the entire object in memory. The original code never did that. It checked one field, found what it needed or didn't, and moved on without ever touching the rest.
So for those specific detectors, the optimization asked Spark to do more work, not less. They now get handled differently instead of being forced through a rule that doesn't suit the shape of their data.
From reacting to preventing
The pipeline reacts. A detector exceeds its budget, we find it, and we fix it. The better version prevents, and that's already underway on both sides of the process. On the authoring side, the performance rules now live in the instructions for the agent that writes new detections, so they apply at writing time. On the review side, our data engineering team added CI checks that enforce them before anything merges.
A detection engineer shouldn't have to become a distributed systems specialist to ship an efficient rule. The knowledge should be in the tooling, applied automatically, so they can spend their attention on understanding the attack.
The takeaway
This project changed the division of labor. Agents do the parallel, detail-dense work of rewriting query logic against a rulebook, and independent gates enforce a bar we were disciplined enough to write down. A controlled experiment against real telemetry decides what got faster, and a human owns the merge.
The durable advantage is the 34 rules and the prepared data underneath them. The agents are what finally let us apply both at the scale the catalog demands.
The analyst should never be surprised by any of this. A detector that got faster should surface the same findings, grouped the same way, with everything that was there before still there. If a performance change is visible from the workbench, it wasn't a performance change. The only thing an analyst should notice is that some alerts now arrive carrying more context than they used to.
If you build detections for a living, you know which of your detections fire. Do you know which ones finished last night? The ones that didn't are the quietest gap in your coverage, and nothing in your stack is going to raise its hand.
FAQ
What does it mean for a detection rule to be terminated?
A terminated rule exceeded its execution budget and was stopped before completing. It returns no results, not partial results, and not an error most alerting pipelines would flag. From the outside, a terminated run and a clean environment produce identical output, which is what makes it a coverage problem.
How do you know an optimization didn't break the detection?
No single check decides it. A row-level equivalence test, an independent behavioral review, and a live before/after run each catch a different kind of failure, so a bug has to slip past all three.
Why can't you just flatten the expensive fields upstream?
Because detectors across our catalog use 138 distinct fields from the two containers, and any single event populates only a handful. A shared schema would be mostly empty on every row. Declaring fields per detector avoids paying for the rest.
Is standard PySpark performance advice safe to follow?
Only if you know what your platform already does. cache() and broadcast() help an isolated job, but they cost you when the infrastructure around them is already caching, because then you're spending shared memory to redo work that's already done. "Safe" is a property of the whole system.
Why not just optimize everything once and be done?
Because performance regression is a standing condition. Volumes grow, new detections ship, and customer environments change shape, so detectors drift toward their limits continuously. A one-time refactor treats a recurring problem as an emergency and pays emergency cost every time it recurs.


